Maybe it's just the brutal Southern California heat we've had all summer, but we've been wondering about cold beverages lately, particularly in the soda, energy and sports drinks categories.
In each category, most of us seem to have our go to beverages (for example, this blogger is particularly fond of Cucumber-Lime Gatorade) but what is behind this loyalty? How do people begin category relationships with certain beverages, how to they develop brand loyalty within that category, and what can break them out? Focusing on sodas (like Coke), energy drinks (like Red Bull), and sports drinks (like Gatorade), we tapped into our proprietary Field Agent Database, surveying 1,661 North American respondents, 18 years or older, between May 10 and May 24.
A few of the questions we asked: how do price, health, and social pressures influence people's beverage choices, and how can manufacturers and retailers capitalize on these trends? What builds and disrupts consumer loyalty, what do current health trends mean to certain beverages' futures, and, ultimately, what will Americans be drinking fifty years from now?
These are some of the questions our 2017 Beverage Industry Report set out to answer.
Soda is the Nation's Most Popular Beverage Category
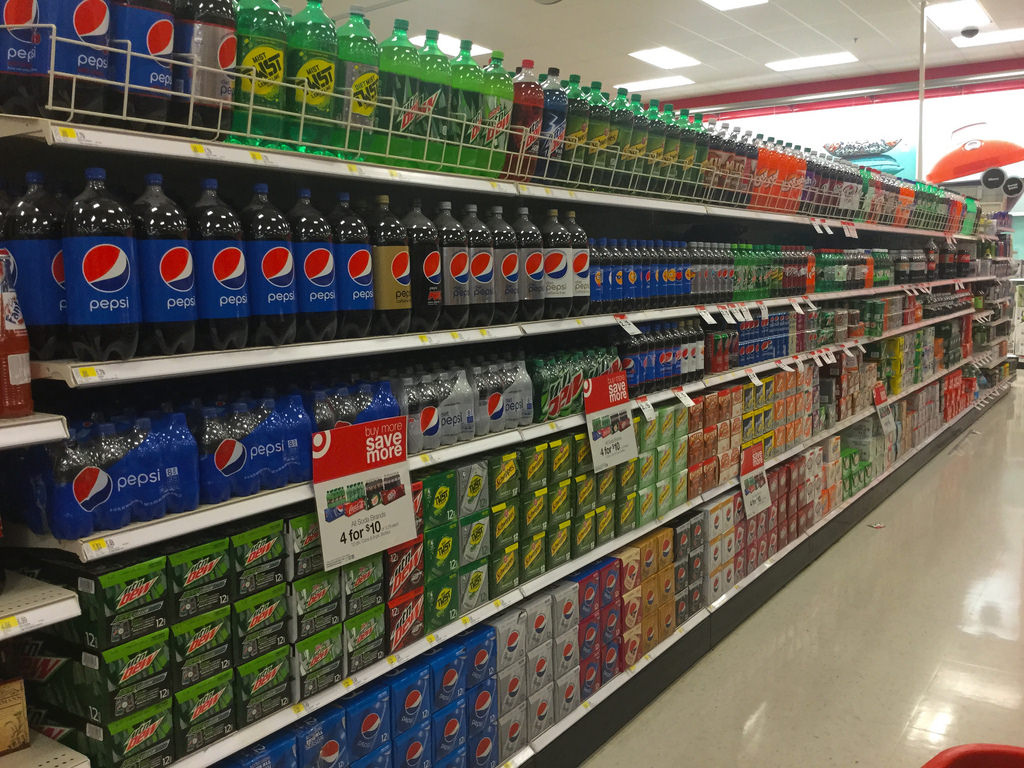
Right off the top, we're just going to say it: A lot of Americans still drink sodas. Between December of last year and May of this year, 92% of our respondents had consumed at least one soda. Over the same period of time, an identical number of respondents drank water. This is staggering because water, both as a naturally occurring liquid and as a fundamental necessity of human life, has an obvious leg up.
Of course, these numbers don't consider frequency of consumption (more on that in the study itself), but nonetheless, in a moment where we are bombarded with tales of soda's inevitable demise in favor of healthier products, we found the case on the ground to be far different. Further demonstrating soda's continued category dominance, only 50% of Americans had consumed a sports drink over that same time period, and only 31% an energy drink.
Soda, it seems, is still the straw that stirs our national drink market.
And its most frequent consumers are also its most loyal. In ways not seen with sports and energy drinks, the frequency with which one drinks soda directly relates to their willingness to give it up.
Reasons for Energy and Sports Drinks Manufacturer Optimism
Yet makers of energy drinks shouldn't just crash and burn out in the face of this news. On the contrary, there are several reasons for energy drink manufacturer optimism. For example, their most loyal and frequent consumers are age 20-29. This is in stark contrast to soda, where Baby Boomers are by far the most loyal and frequent. Obviously having an ascendant demographic in your corner is the stuff brand managers' dreams are made of, and an entire generation of future consumers is currently being raised on energy drinks, much in the same way boomers were on sodas.
Within the sports drink category, there is some surprising room for competition. Sports drinks are dominated by one brand, Gatorade, which is the favorite sports drinks of 56% of respondents. Yet brand loyalty is not nearly as strong within this category and respondents were willing to switch to another brand when asked about potential price increases and poor health affects. Soda and energy drinkers remained predominately brand loyal in these scenarios, the same did not hold for Sports Drinks, meaning that Gatorade does not have quite the strangle hold on the market we often assume. This leaves room for some plucky upstarts or some already-established competitors to inch into Gatorade's market share.
Of course, these are mere tidbits—for the complete story, you need the complete report
What Else is in the Report?
The full report further identifies trends within the beverage industry in the following:
- Demographic Data
- Intended Purchase Items
- Influence of Health Risk
- Influence of Price
- Reasoning Behind Brand Consumption and Loyalty
- Effects on Brand Consumption and Loyalty
- The Difference Between Brand and Category Loyalty
Click here to download the 2017 Beverage Industry Report: