Did you know that Easter ranks as the second top-selling confectionery holiday behind Halloween? All those baskets and bunnies add up, and at TrendSource, we take a vested interest in finding out what that means to YOU. With the help of our loyal survey respondents, we’ve gathered some Easter-targeted consumer insights, revealing on which products and where consumers will be spending their money this holiday. We hope you enjoy the results. We think they’re pretty egg-cellent…
Celebrating or not?
- 77% of respondents are celebrating Easter this year.
- 71% of those planning to celebrate Easter stated that they are planning to buy gifts for family and friends this year.
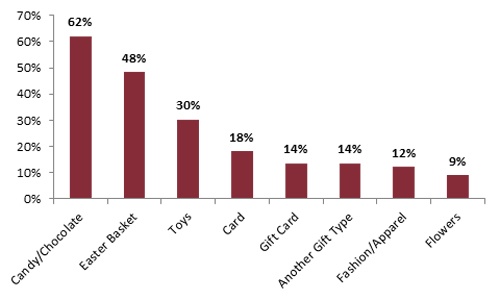
- The top three gift items include Candy/Chocolate, an Easter Basket and Toys.
Top shopping destinations
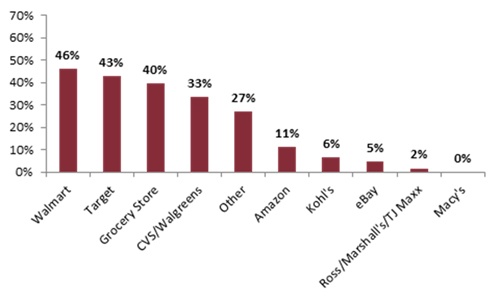
- The top three destinations for these purchases are Walmart, Target and local grocery stores.
Brick-and-mortar is still king
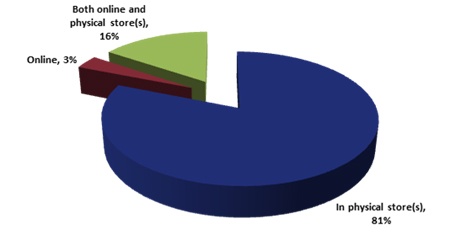
- Egg-spect to see Easter shoppers in your physical stores as 81% of respondents cited this as their intended shopping channel compared to just 3% for online and 16% for both.
Budgeting the Bunny
- The vast majority (77%) of respondents plan to spend $50 or under on their purchases.
What’s for dinner?
- Of those with dining plans on Easter, the majority (53%) plan to dine at home, followed by dining at a relative or friend’s home.
- The average budget for those planning to dine out is $96.00.
The “Easter dress” lives on
- 22% of respondents are planning to purchase a new outfit for Easter with an average budget of $56.25.
Remember, a one size fits all approach is never a good strategy, so don’t put all your eggs in one basket! (...Did I just take it too far?)
Do your Easter plans match up with any of these consumer insights? What do you think about the results?
Methodology: TrendSource surveyed U.S. wINput users between March 20th and 26th, 2013. Results represent a total of 95 respondents (rate of response differed by question). All respondents opted in to respond voluntarily.


