
Treadmill lines at the gym have replaced the long lines at checkout and our recycling bins are full of gift wrap. We measured how consumers intended to spend their dollars during the 2013 holiday season in our Pre-Holiday Insights Study (infographic here), but how did their intentions hold up against their actual spending habits? Our Post-Holiday Study is finally here to answer those questions!
Let’s pour ourselves a hot cup of detox herbal tea and reflect on the whirlwind of the holidays.
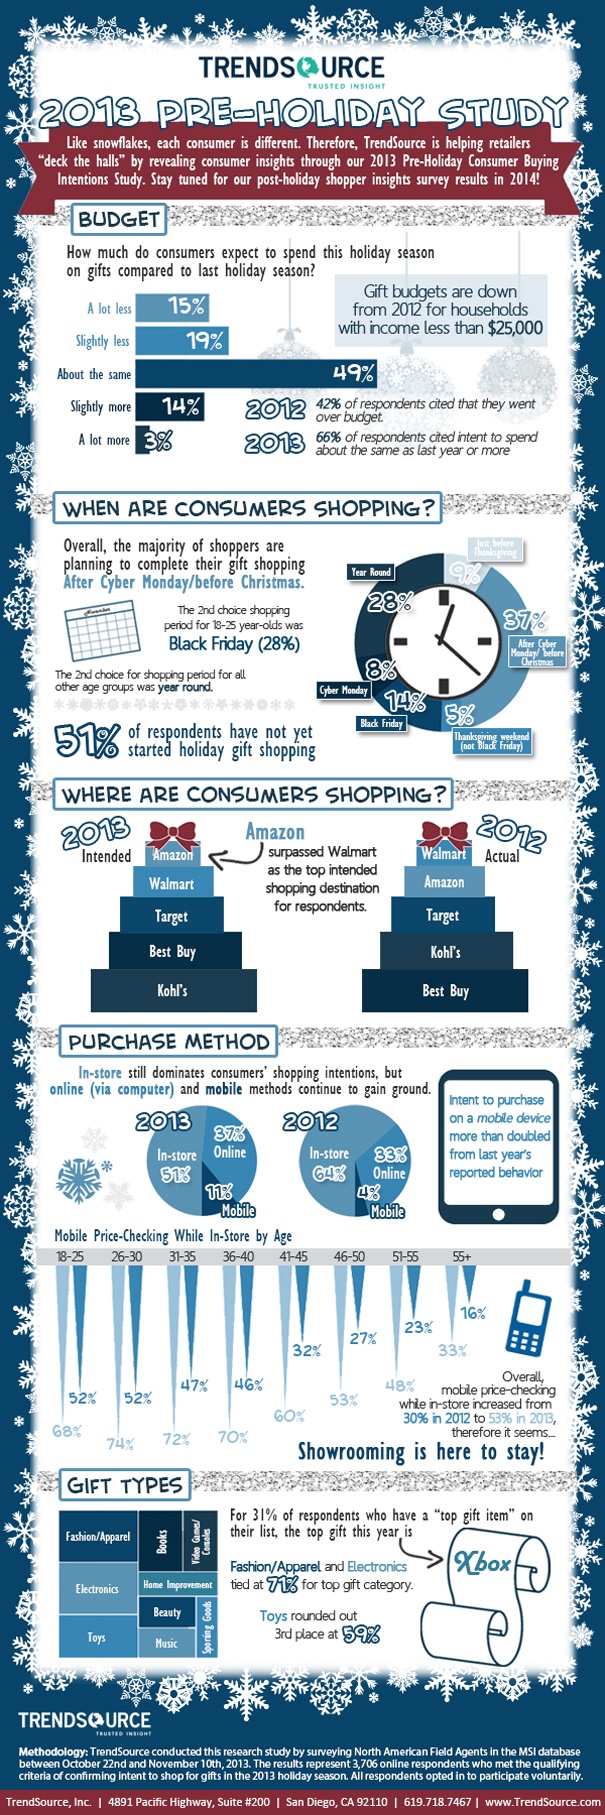
Very Little Jingle Left
Where did all of the coin jingling in my pocket go? Straight down the chimney it seems. 42% of respondents went over budget! The savviest of the bunch were those with household incomes of less than $25,000 with almost 45% of them stating that they were under budget. Overall, we overdid it more than we did in 2012 with those of us going over budget in 2013 spending an average of $85 more over budget than in 2012. With 42% going over budget this year, our projected 44% was on-target. See projections in our 2013 Consumer Buying Intentions Insights Report.
How Much Get-Up-and-Go Was in Our Ho! Ho! Ho!?
Although holiday shoppers confirmed intent to complete a significant portion of their gift shopping over the Thanksgiving weekend, actual outcomes indicate that they delayed most of their gift shopping with 46% of them hitting the stores after Cyber Monday. Between over-eating turkey and parties, maybe they were more worn out than anticipated.
Does Santa Have a Smartphone?
Not sure, but everyone else seems to. The use of mobile devices during gift purchasing keeps increasing and this holiday season kept up with the trend. 10% of respondents utilized a mobile device to make a holiday purchase vs. 4% last year. That's more than double! We also observed an uptick in utilizing a mobile device to check prices while in-store: 36% in 2013 vs. 30% in 2012. Although the increase is significant, it was not 53% as cited in our Pre-Holiday Study. It’s possible that the deep seasonal discounts offered at retail lessened the need to look elsewhere online.
Some Surprises Weren't Placed in Stockings with Care
Our respondents touted loudly that Amazon was going to be their #1 choice for gift purchases in 2013. But, that wasn't the case. Surprisingly, Walmart kept its top spot as 57% of respondents stated Walmart was their #1 retail destination where only 55% stated Amazon. Kohl’s also beat Best Buy, 29% to 26%. The opposite was cited as our respondents’ intentions in the Pre-Holiday Study. The biggest surprise of all was Toys “R” Us falling to number 9 from number 6 in the top 10, just above Barnes & Noble. Only 15% of our respondents cited this retailer as their #1 destination.
Service – Frightful and Delightful
Although the holiday shopping season can be a nightmare for many, Amazon came through as a shining star with consistent praise: ease, price, selection. 16% of respondents put this online retailer above all the rest when asked where they received their “best service”. Target came in second at 9%.
So Much to Choose From
We are constantly bombarded with products. So, how did we learn about the products that were going to be on the top of our list? Word of mouth! 37% of respondents learned about the top holiday gift products via good ol’ conversation. Although it was the number one method, our Pre-Holiday Study cited it at 69%, which is significantly higher than what actually occurred. Where did social media fit in? 62% of our respondents did not consult social media regarding gifts. Of those that did head to social media, the top four sites were Facebook, Pinterest, Instagram and Twitter. Although Facebook came in #1, the results showed that they were consulted significantly less than that the intentions cited in our Pre-Holiday Study, and Pinterest was consulted more often than intended.
What Ended Up in the Back of the Sleigh?
Fashion and Apparel was the number one gift of choice as 68% of our respondents purchased this category the most. Electronics trailed right behind at 61%. The big upset occurred further down the bench: only 17% cited music as a gift choice which was down from 30% as cited in the Pre-Holiday Study and down from 19% actually gifted in 2012. Sporting goods gained some ground as 21% of respondents gave the gift of sports in 2013 vs. 19% in 2012. Another interesting twist was in the Video Game and Consoles category. Only 26% of respondents gave this gift in 2013 vs. 31% in 2012. Oddly, 37% cited their intention to do so, but didn't pull the trigger.
It all seems so exhausting. But not to everyone - 25% of our respondents keep their eye out for holiday gifts all year round. More power to them! In the meantime, we’ll be keeping an eye out for more seasonal consumer insights. Until then, please download the full 2013 Post-Holiday Consumer Insights Study below.
Methodology: TrendSource conducted this research study by surveying North American Field Agents in The Source database between January 3, 2014 and January 12, 2014. The results represent 2,948 online respondents who met the qualifying criteria of confirming gift purchasing during the 2013 Holiday Season. All respondents opted in to participate voluntarily.
