PHASE 1
Background
A national grocery chain’s ‘Star Retailer’ program was designed to recognize high performing grocery retailers based on specific criteria. Each year Company X retailers undergo a series of rigorous assessments to ensure that customers are encountering exceptional shopping experiences each and every time they enter a Company X grocery store. In-store appraisals are combined with training and customer feedback evaluations to create a thorough assessment process, and in the end, only the very best retailers are awarded the coveted Star Retailer status.
PHASE 2
Client Objectives
In an effort to understand if a link between customer satisfaction and Star Retailer status existed, TrendSource completed a correlation study of online survey Voice of the Customer (VoC) data for Star and non-Star Retail locations.
PHASE 3
Implementation
A total of 255 out of approximately 1,200 U.S. Company X retailers were classified as Star Retailers in 2011 and identified as “Star Stores” for the purpose of this analysis. The VoC results from Q4 for Star Stores (totaling 3,027* surveys at 207 stores) were compared against the VoC results for stores that were not Star Stores (totaling 3,987 surveys at 457 stores).
An analysis of top box scores (5 rating) responses to VoC survey questions was executed and hypothesis testing was used to determine if meaningful differences exist between satisfaction of Star Store customers and Non-Star Store customers.
Additionally, a correlation analysis was then applied to VoC results to understand if meaningful differences in customer perceptions and willingness to recommend the location exist between Star and Non-Star retailers.
PHASE 4
Key Findings –Star Store Customers have more positive perceptions
Survey responses at Star Stores received significantly* higher top box (5 rating) responses on 68% of the core survey questions (or 22 of 32 total questions). Specifically, these higher top box responses were in the following areas:
- Overall satisfaction
- The value of grocery brand products
- Overall interior cleanliness
- Overall exterior cleanliness
- Friendliness of sales floor associates
- Availability of associates at a service counter
- Friendliness of the checker/cashier
- Checkout wait time
- Overall checkout experience
- Product quality
- Product freshness
- Recommendation of the grocery location
- Likelihood of returning to this grocery location
The results of the analysis indicated that customers at Star Stores were more satisfied with their overall experience, specifically in select areas related to service and product quality, and they were more likely to recommend and return to the Star Company X locations than customers at non-Star Stores.
PHASE 5
Key Findings – Differences in Star Store Customer Expectations
Conclusion 1: Many variables were moderately correlated to willingness to recommend the location at both Star and non-Star Stores highlighting potential areas of focus that will have the highest impact on customer perceptions. (Figure A)
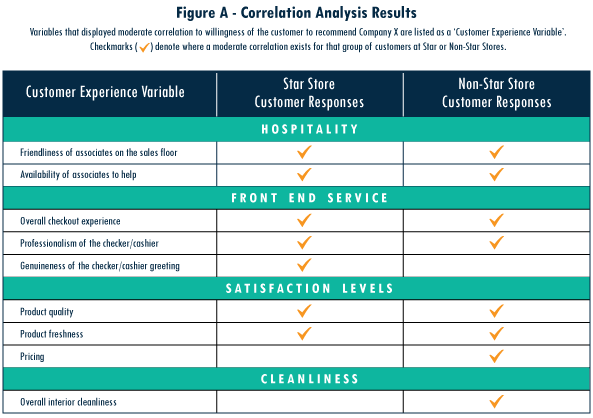
Conclusion 2: The following differences are evident between the two customer segments:
- At non-Star Stores, customer responses were moderately correlated to willingness to recommend the location in the following additional areas that did not show a notable correlation at Star Stores:
- Cleanliness – Overall interior cleanliness
- Satisfaction levels with pricing
- At Star Stores, customer responses were moderately correlated to willingness to recommend the location in the following additional areas that did not show a notable correlation at non-Star Stores:
- Front End Service – Genuineness of the checker/cashier greeting
The differences in the results indicated that customer expectations at Star Stores were different from expectations at non-Star Stores. The overall interior cleanliness of the location and satisfaction with pricing were contributors to customers’ willingness to recommend the location at non-Star Stores, but not at Star Stores. Additionally, at Star stores, the genuineness of the greeting made by the checker/cashier was more impactful than it was at non-Star stores.
PHASE 6
Conclusion
From a strategic perspective, the results of this analysis validated the Company X Star Retailer program as a significant measure of top performance with the outcome of having more satisfied customers. Additionally, Star Store customer expectations were no longer significantly impacted by interior cleanliness of the store or prices. Star Store customers were also more likely than non-Star Store customers to recommend the grocery location based on service measures, such as genuineness of their interaction with the checker/cashier.
* Statistically Significant Difference – denotes significant difference at 95% confidence level.